MSBI (SSIS/SSRS/SSAS) Online Training

Wednesday, May 11, 2011

How to generate SSRS Report and How to deploy in MOSS


Hi,
Here you can learn how to deploy/integrate a SSRS report with MOSS application.

Assumptions:
Report Server has been configured for SharePoint Integration Mode.
SharePoint Report Server Integration Feature is activated.
Appropriate Content Types (Report Builder, Report Builder Report, Report Data Source) have been added to a Document Library within a site.

For further information on these configuration topics, see Deploying SSRS with SharePoint Integration.

Assume the following server/site/library/folder names:
• Server Name = MyServer
• SP Site = SiteABCReports
• Doc Library = SSRS Reports
• Data Sources Folder (optional) = Data Sources
• Report Models Folder (optional) = Models
• Reports Folder (optional) = Reports

Deploy Report Designer Reports

From within a SQL Server Business Intelligence Studio (BIDS) Report Server Project, go to the project’s Property Page (right-click project in Solution Explorer and select Properties).
Apply the following deployment settings:
• Overwrite ExistingDataSources = True
• TargetDataSourceFolder = http://MyServer/SSRS%20Reports/[Data%20Sources]
• TargetReportFolder = http://MyServer/SSRS%20Reports/[Reports]
• TargetServerURL =http://MyServer

Where [‘xxx’] denotes optional.

Things to note:

• A TargetReportFolder must be specified. The folder can be the document library or a folder within the document library.
• The TargetDataSourceFolder is optional. If one is not specified, the Data Source will be deployed to the TargetReportFolder.
• For both target properties, if the folder within the document library does not already exist, it will be created upon deployment.
• Relative paths are not valid.
• The replacement of the space character with %20


See the below article for step-by-step approach to deploy the report on MOSS.
http://mosshowto.blogspot.com/2009/02/reporting-services-2008-report.html

Here you can download some of the sample SSRS reports,it’s really nice work.
http://blogs.msdn.com/b/chrisfie/archive/2008/04/10/new-sql-reporting-services-sample-reports-for-project-server.aspx

Linked server in sql server 2008


Hi,
When you are setting up a linked server, register the connection information and data source information with SQL Server. After registered, that data source can be referred to with a single logical name.
You can use stored procedures and catalog views to manage linked server definitions:
• Create a linked server definition by running sp_addlinkedserver.
• View information about the linked servers defined in a specific instance of SQL Server by running a query against the sys.servers system catalog views.
• Delete a linked server definition by running sp_dropserver. You can also use this stored procedure to remove a remote server.
You can also define linked servers by using SQL Server Management Studio. In the Object Explorer, right-click Server Objects, select New, and select Linked Server. You can delete a linked server definition by right-clicking the linked server name and selecting Delete.
When you execute a distributed query against a linked server, include a fully qualified, four-part table name for each data source to query. This four-part name should be in the form linked_server_name.catalog.schema.object_name. For more information, see Distributed Queries.

Step-by-step procedure available in below article.
!! Thanks madhu !!
http://madhuottapalam.blogspot.com/2008/08/configuring-linked-server-from-sql.html

SSIS Migration from 2000 (dts) to 2008 (dtsx)


Integration Services provides the DTS Package Migration Wizard for migrating SQL Server 2000 Data Transformation Services (DTS) packages that were created by using the DTS tools and object model.
Not all packages can be migrated completely. For example, some DTS tasks do not map to Integration Services tasks, custom tasks cannot be migrated, and some scripts in ActiveX Script tasks or in data transformations cannot be migrated. For more information, see Migrating Tasks and Known DTS Package Migration Issues.
Packages left in the DTS package format can be used in Integration Services solutions and can also continue to run as stand-alone DTS packages.
Many DTS packages are password-protected. If you migrate these packages, the Package Migration Wizard prompts you for their passwords. You cannot migrate a password-protected package unless you provide the correct password.
SQL Server does not install support for Meta Data Services. The Package Migration Wizard supports Meta Data Services (Repository) packages only if SQL Server 2000, the SQL Server 2000 tools, or the Repository redistributable files are installed on the local computer. When the Repository files are present, the Package Migration Wizard can migrate DTS packages that were saved to Meta Data Services. When the Repository files are not present, the Package Migration Wizard can only migrate DTS packages that were saved to SQL Server or to structured storage files.
You can find some known issues in migration here

http://www.simple-talk.com/sql/ssis/dts-to-ssis-migration/
http://technet.microsoft.com/en-us/library/ms143462.aspx

I have some nice links which describes step by step how to migrate DTS to SSIS 2008.
I hope that will help u goto following urls:

http://www.infosys.com/microsoft/resource-center/DTS-SSIS-2008-migration.pdf

http://weblogs.sqlteam.com/derekc/archive/2008/02/19/60518.aspx

http://wiki.sqlis.com/default.aspx/SQLISWiki/MigrationWizardSteps.html


Downloads:
http://pragmaticworks.com/DTSxChange-vs-MSWizard.pdf

Video link for "how to migrate SQL Server 2000 DTS packages to SQL Server 2008"

http://www.msdev.com/Directory/Description.aspx?eventId=493

Saturday, April 2, 2011

Geospatial Data with Sql Server 2008 R2


Overview
Microsoft SQL Server 2008 delivers comprehensive spatial support that enables organizations to seamlessly consume, use, and extend location-based data through spatial-enabled applications which ultimately helps end users make better decisions.
Top New Features
• Use the new geography data type to store geodetic spatial data and perform operations on it
• Use the new geometry data type to store planar spatial data and perform operations on it
• Take advantage of new spatial indexes for high performance queries
• Use the new spatial results tab to quickly and easily view spatial query results directly from within Management Studio
• Extend spatial data capabilities by building or integrating location-enabled applications through support for spatial standards and specifications

Visual analysis of location data
Geographical Factors in Decision-Making and Analysis
The spatial support in Microsoft SQL Server 2008 can help you make better decisions through visual analysis of location data.
Make better decisions
Visual analysis of location data in scenarios such as:
• Consumer-focused location-based information
• Customer-base management and development
• Environmental-related data impact, analysis, and planning
• Financial and economic analysis in communities
• Government-based planning and development analysis
• Market segmentation and analysis
• Scientific research study design and analysis
• Real-estate development and analysis

Geodetic Model


Planar Model
Comprehensive Spatial Support
Build spatial capabilities into your applications by using the support for spatial data in SQL Server 2008.
Work with geodetic data
• Implement Round Earth solutions with the geography data type. Use latitude and longitude coordinates to define areas on the Earth’s surface
• Associate geographical data with industry standard ellipsoids, such as WGS84, which is used in GPS-enabled solutions worldwide
Work with planar data
• Implement Flat Earth solutions with the geometry data type.
• Store polygons, points, and lines that are associated with projected planar surfaces and naturally planar data, such as interior spaces
Build on industry standards
• Import and export spatial data in industry-standard formats, such as Well Known Text, Well Known Binary, and Geographic Markup Language (GML)
• Take advantage of geometry data type compatibility with Open Geospatial Consortium (OGC) standards for geometric data types
Perform spatial operations
• Use the methods provided by SQL Server 2008 spatial data types to write Transact-SQL code that performs operations on spatial data, such as finding intersections between geospatial objects and distances between locations

Spatial Results Tab
High Performance Spatial Data Capabilities
Achieve high performance spatial capabilities with SQL Server 2008
Store large and complex spatial objects
• Use the spatial types in SQL Server 2008 to accommodate spatial objects, regardless of whether the objects are simple or very complex
Build high-performance solutions with spatial data indexing
• Enhance query performance by using indexes for spatial data that are integrated into the SQL Server database engine
• Take advantage of accurate query optimizer cost assessment for spatial queries that can determine the optimal query plan and identify appropriate index selection
View results directly from within Management Studio
• Use the new spatial results tab to easily view spatial query results directly from within SQL Server Management Studio
• Simple projection and zoom/pan capabilities for quick investigation
Consolidate relational and spatial data in business applications
• Use the native support for spatial data types in SQL Server 2008 to seamlessly incorporate spatial data into line-of-business applications
• Avoid the performance and manageability issues associated with a dedicated spatial data store

Virtual Earth SDK
Geospatial Application Extensibility
Extend spatial support by integrating spatial data in SQL Server 2008 with location-enabled applications and services.
Build spatial solutions of any scale
• Take advantage of spatial support in multiple editions of SQL Server 2008, from SQL Server Express to SQL Server Enterprise Edition
Use spatial standards support to integrate applications
• Leverage a .NET-based geometry library that supports OGC standards. Build applications that consume and manipulate spatial data
• Integrate with geospatial services, such as Microsoft Virtual Earth, to build comprehensive location-enabled solutions that render your spatial data for display
Benefit from spatial community support
• Take advantage of spatial products and services offered by Microsoft partners that integrate with SQL Server 2008
• Microsoft partners with the leading GIS application providers and a range of spatial community organizations, integrators, and ISVs that support SQL Server 2008

I copied from the below site.
http://www.microsoft.com/sqlserver/2008/en/us/spatial-data.aspx

For Installing SQL Server 2008 R2 on Windows Server 2008 R2, See the below link:
http://www.mytechmantra.com/LearnSQLServer/Install_SQL_Server_2008_R2_P1.html

Visualizing the SPatial Data:
http://msdn.microsoft.com/en-us/magazine/ee335706.aspx
Download 'SPatialData' detail document and sample script from here.
http://download.microsoft.com/download/a/c/d/acd8e043-d69b-4f09-bc9e-4168b65aaa71/SpatialData.doc
Watch the video:
http://blogs.msdn.com/b/nikosan/archive/2010/11/06/data-connector-web-cast-dec-2nd-2010.aspx

Regards,
Ravindra

Monday, March 28, 2011

URGENT REQUIREMENT IN A MNC FOR MSBI RESOURCE(SSIS/SSAS/SSRS)-***only in USA***

Hi Guys,
If you are in MSBI plaform(SSIS or SSAS or SSRS), send me your profile on my emailID.
It is really good opportunity who looking to change.
!! All The Best !!
============================================
eMailID:-->nv.ravindranathreddy@gmail.com
============================================
Regards,
Ravindra

Tuesday, March 15, 2011

SSAS-Dynamic Cube Partition Refresh

Hi,

Here you can see Refresh the Cube Partition dynamically using SSIS Package.

The steps are involved,
 Drop the existing Partitions on the cube
 Re-Create the Partitions.
Get more details about Cube-Partitions.
http://msdn.microsoft.com/en-us/library/ms175604.aspx
Here is the link to implement Partition at cube level.
http://sql-bi-dev.blogspot.com/2010/12/dynamic-cube-partitioning-in-ssas-2008.html
Download the sampl SSIS-Package here.
http://www.ziddu.com/download/14205603/Cube_Partition.zip.html

Regards,
Ravindra

Table Partition and Archive the OLD data from a Table - Sql Server

Hi Friendz,
Here i would like to introduce a concept called 'Partition On Table' in Sql server 2005/2008.

I am using SQL Server 2008 and I have table called, ‘Monthly Product’ (it contains data from 2010-January to till) every month data load approximately 30 million records, I only need to read last 12 months data for my report. Because of huge data my table response is too bad.

Then my option is -
Partition the table based on monthly wise,
Clustered Indexes then
Archive the OLD data (<12 months) into a Text file.
You can see better performance on your query using partition table.


Here i will run the package on monthly basis.
 The first task removes the Partitions on the table and re-create for last 12 months.
 The second task will Archive the Old data (< 12 months)
 The third task deletes the old data from the Report table.

Read More about Partitions:
http://msdn.microsoft.com/en-us/library/ms345146(v=sql.90).aspx
You can Download The sample package from the below link.
http://www.ziddu.com/download/14205160/IntegrationServicesProject2.zip.html

Thanks, Rav's

Tuesday, March 1, 2011

Happy Maha-Shivaratri to All...!


Wishing you all a very happy Mahahivrati. God bless you all with lots and lots of happiness, your wishes will be accomplished. Om Namah Shivaya..

Data Architect, Data Warehouse Architect and BI Solution Architect


What is the difference between a data warehouse architect and a data architect? How about BI solution architect?
Both data architect and data warehouse architect do data modeling, as in ERWin stuff. Or Embarcadero ER Studio. But a data warehouse architect is more specialized on designing the data model for a data warehouse, whereas a data architect is more specialized on designing the data model for databases used by transactional systems.
A data warehouse architect does a lot more than just data modeling. They also do the ETL and the infrastructure. These are areas that a data architect doesn’t do normally.
For a data architect to be able to call themselves a data warehouse architect, they don’t only need to learn how to create a data model for a data warehouse (as in dimensional modeling). But they need to also understand the ETL architecture. And they need to understand the servers. For example, they need to be able to specify the specification for the production data warehouse servers, i.e. CPU, memory, disks. And other server stuff like clustering, mirroring and DR. And they need to understand physical database stuff too, like table partitioning, file groups and materialized views.
In my book I specify there are 2 sides of data warehouse architecture. The first one is the logical architecture and the second one is physical architecture. A warehouse architect needs to understand both.
A data warehouse architect in my opinion demands 4 separate skills: data architecture, ETL, database platform and physical infrastructure. By “database platform” I mean SQL Server knowledge, Oracle knowledge, Teradata knowledge, Netezza knowledge, etc. For example, “SQL Server 2008 Data Warehousing Features” is a “must know” for a DW architect in SQL Server. Whereas UPI & USI is a “must know” for DW architect in Teradata. If we design a DW on Oracle 11g R2, we need to know Oracle specific DW features, such as Initialization Parameter Settings, Partitionwise Joins, Compression, Parallel Execution, etc.
A BI architect is more on the application side, as in SharePoint architecture, Hyperion architecture, Reporting Services architecture, and Analysis Services architecture. For example: a BI system where we have reporting services running on SharePoint, plus excel services and PPS services on SharePoint, and SSAS cubes too reading from a warehouse or mart. And on top of that some custom .NET coding for authentication or customized security. Plus they allow some self-service BI using Qlikview or PowerPivot.
Back to the data warehouse architect, the ETL aspect of the job is sometimes quite demanding. There is something called ETL architecture in warehousing, which is basically
a) the architecture of the overnight batch, i.e. the structure of the tasks and workflows, the execution order of the workflows, the backup, the reconciliation, the checking and alert, and the data quality. The overnight batch is not only about data loading / ETL. It also has: data serving elements, i.e. processing reports (stored as PDFs, ready to be served to achieve split second response time), refreshing OLAP cubes.
b) the architecture of the continuous feed throughout the day for real time warehousing
c) the physical infrastructure of the ETL, i.e. the servers, the databases, the data connections
d) the methods to extract and load the data i.e. sliding window, swap partition, flipping twin tables, identifying incremental extraction, changed data capture, change tracking mechanism, (filtered) replication between warehouse and mart (or mirroring), how to extract data from cubes.
If a data warehouse architect only understands dimensional modeling, the company will have problems in the ETL and infrastructure. The servers might not be ‘suit for purpose’, for example disk configuration is not optimized for warehousing.
How about “BI solution architect”? A data warehouse is the back end. Business Intelligence is the front end. Data warehousing is about the data model, the ETL and the databases. BI is about the reports, the OLAP cubes, the analytical applications, the data mining, the KPIs, the dashboards, the score cards, and the performance management. It is a common perception that a BI solution architect is a “front end” person. An application person. This perception is incorrect.
A “solution architect” is responsible for the whole solution. Not only the front end, but also the back end. It is impossible for him to be responsible for the whole solution without looking after the back end. In the case of a BI solution architect, he or she needs to look after both the BI front end (reports, cubes, performance management, etc.), and the back end (data warehouse, ETL). It is impossible for a BI solution architect to be responsible for the BI without looking after the data warehouse. In some companies, instead of calling the role “BI solution architect”, it is called “data warehouse solution architect”. It doesn’t mean that the role is only responsible for the back end data warehouse, but he is also responsible for the BI front end. In some companies, they have not only one but several BI solution architects, each responsible for a certain area.
There are several different types of architects in IT, for example: system architect, data architect, solution architect, information architect and enterprise architect. This segregation of duties only happens in very large group of companies (enterprises). For example, a banking group with 3000 IT staff. If the IT staff is only 100 usually the architect does multiple functions. A system architect is responsible for infrastructure, including networks and servers. I’ve mentioned about data architect and solution architect. An information architect is responsible for the flow of information throughout the enterprise, including databases and data quality. An enterprise architect is responsible for all the applications in the enterprise, making sure they run in sync and adhere to the standards.


You can find more details from below blog:
http://dwbi1.wordpress.com/2010/06/16/data-architect-data-warehouse-architect-and-bi-solution-architect/

Thursday, February 24, 2011

SSAS-Implementing Analysis Services synchronization

Synchronization is a fairly simple concept resembling the snapshot replication feature available with a SQL Server relational database engine. Synchronization copies the data files from the source server to the destination server. For example, you could synchronize an Adventure Works sample database from server A to server B. If server B (destination) does not have this database yet, it will be created during synchronization. If server B already has the Adventure Works database, it will be overwritten.
If the destination database exists, it remains online while you synchronize it, so your users can continue querying the database. Analysis Services creates a separate folder in the data directory of the destination server. This folder will have a globally unique identifier (GUID) as its name -- for example 761A1D04B1C476A9886 -- and will contain only files that were modified since databases were last synchronized. In other words, synchronization is always incremental.
Note, however, that before incremental changes can be transferred you must first synchronize the entire database. Once you synchronize a primary database from a secondary database, you will only have to copy a subset of all files for subsequent synchronizations. The first synchronization must copy all files, even if the existing copies of data on both servers are identical. Keep in mind that since all files must be copied for the initial synchronization, you will need plenty of disk space to store the existing database files and those files that are being copied from the standby server.
After all necessary files are copied to the synchronization folder, Analysis Services deletes the existing folder, storing the current database files, and replaces it with the folder containing synchronized files. The change occurs very fast because it's a matter of renaming the folder from GUID to the database name (and version number). Users can continue querying the primary database, although queries will fail for a brief period while the folder is being renamed.
For example, the following command synchronizes a test database between two instances of Analysis Services:

Exploiting Analysis Services synchronization
You can use the SYNCHRONIZE command to:
Have a standby Analysis Server dedicated to processing. The primary production server will be dedicated to user queries. After you process cubes on the standby server, you can transfer modified data files to the production server.
Deploy changes from the development environment to production servers. You can include the security settings that exist on the development database or keep those settings that are defined in production. If the development database only has a subset of production data, then you will need to reprocess the production database once synchronization is complete.
Keep multiple copies of the same database on multiple servers for scaling out your analytical solution. If there are thousands of users querying your cubes, you can direct a subset of users to each server.
Keep multiple copies of the same database on multiple servers to assure high availability. Should any of your servers experience hardware issues, you could redirect users' queries to other servers.
Copy the production database to development or quality assurance servers when you need to troubleshoot performance or data accuracy issues.
Here is the screen shots for oyur referrence.


You can get more details from the below page:
http://searchsqlserver.techtarget.com/tip/Synchronizing-Analysis-Services-2005-databases-in-SQL-Server

Saturday, February 19, 2011

MSBI Interview Questions and Answers

Guys,
Based on my friend request i have been posted latest questions with answers.
Please let me know if you have any comments and keep me updated with the latest questions, i will try to post you answers ASAP.
Take care
~Rav’s
SSIS
1) Use Of Event Handlers
Based on event (On error, on Progress, On Pre/Post Validate..), if you want to perform some action like send email, insert log info into table etc.. we can go for Event Handler Tab.
http://msdn.microsoft.com/en-us/library/ms140011.aspx
http://consultingblogs.emc.com/jamiethomson/archive/2005/06/11/SSIS_3A00_-Custom-Logging-Using-Event-Handlers.aspx
2) Diff b/w script task & script component and its advantages.
Script task is control flow level item where as script component is data flow level item, both of the functionalities are same. This 2 are very powerful items in SSIS.
Normally we can implement custom code by using these components.
By using this two items we can perform any action like DML operations on the data from DB, file and we can do any operation using c# or vb.net code we can use it as Source, destination as well. In single sentence i can conclude the usage of this items we can use to perform any ETL operation if you are good at .net.
http://sqlblog.com/blogs/andy_leonard/archive/2007/10/14/ssis-design-pattern-read-a-dataset-from-variable-in-a-script-task.aspx
http://www.ssistalk.com/2007/04/04/ssis-using-a-script-component-as-a-source/
3) What is a Master package.
Master package is nothing but it is also a normal SSIS package, it act like a master to run the all other (child) packages. If you call the other SSIS packages in a new SSIS package using ‘Execute Package Task’, the new package called as master package. The use of this package(Master) is, instead of running all individual packages if we can run the single master package, then automatically all the child packages will run. Normally we simply schedule the master package in Sql server agent by adding the all child packages values in the master package config file.
http://sqlblog.com/blogs/jorg_klein/archive/2010/01/04/ssis-package-design-pattern-for-loading-a-data-warehouse.aspx
4) Have you worked with data source view in ssis.
You can simply say ‘i never used so far’.
A DSV allows you to create a metadata layer over an existing Data Source. Within a DSV, you can select a subset (or all) of the tables and views available from a Data Source, rename any of the tables/views and/or their columns, add new Named Calculations (which act like computed columns within a table/view), and add new Named Queries (which are complete select statements, which basically act like views).
http://database.blogs.webucator.com/2010/10/20/how-to-create-data-source-views-in-sql-server-integration-services-2008/
5) If there are 100 Packages, do you create 100 configuration files or u create how many.
The answer is based on the requirement we will create 100 config files for 100 packages.If i go for master package and if i am using same kind of connections for the child packages like source and destinations connections then we will create less config files, because Master Package will pass all the connections using master-child relation using the variables. Creation of config files is dependence of the requirement.
http://www.mssqltips.com/tip.asp?tip=1434
http://www.sql-server-performance.com/articles/dba/package_configuration_2005_p1.aspx
ssas
1) Difference b/w Cube-Deploy and Process.
Once you build the cube in the BIDS, we can say the structure of the cube is created. So once the cube structure is built we need to deploy the structure to the actual Sql server analysis server. This process is called DEPLOYMENT of cube. (like creating one object(table) in the relational database)
So once you deploy the structure to the SSAS server, we need to load the data into the structure we have created. This process of loading data into the cube and creating the aggregations is called Cube processing.(like inserting the data into your table)
So to make a cube online for the user for querying we need to build the structure of the cube in BIDS and deploy it to a SSAS server and the process it to load with data and aggregations, then the user can query on the SSAS cube.
Best Practice method to deploy a cube:
http://www.mssqltips.com/tip.asp?tip=1883
2) Different kinds of Dimensions. like Degenerate dimension, Conformed dimension, Junk dimension with example.

Different types of Dimensions:
I.SCD (Slowly Changing Dimension- Type 1 Type 2 and Type 3)
Type 1: The new record replaces the original record. No trace of the old record exists.
Type 2: A new record is added into the customer dimension table. Therefore, the customer is treated essentially as two people.
Type 3: The original record is modified to reflect the change
II. There are other three types of Dimensions:
1. Confirmed Dimensions.
2. Junk Dimensions.
3. Degenerate Dimensions.
-Confirmed Dimension:
The dimensions which is used more than one fact table is called conformed dimensions. It means we can definitely use CD in the nature
Ex: Time,Geography,customer,employee,product etc..
-Junk Dimension:
Junk dimensions are dimensions that contain miscellaneous data (like flags and indicators) that do not fit in the base dimension table.
-Degenerate Dimension :
A degenerate dimension is data that is dimensional in nature but stored in a fact table. For example, if you have a dimension that only has Order Number and Order Line Number, you would have a 1:1 relationship with the Fact table. Do you want to have two tables with a billion rows or one table with a billion rows. Therefore, this would be a degenerate dimension and Order Number and Order Line Number would be stored in the Fact table
III. Cube Dimensions
a. Fact Dimensions
b. Role-Playing Dimensions
c. Reference Dimensions
d. Many-to-Many Dimensions
http://consultingblogs.emc.com/christianwade/archive/2005/04/07/1255.aspx
http://www.informaticans.com/blog/data-warehousing-faqs/dimensions-different-types/

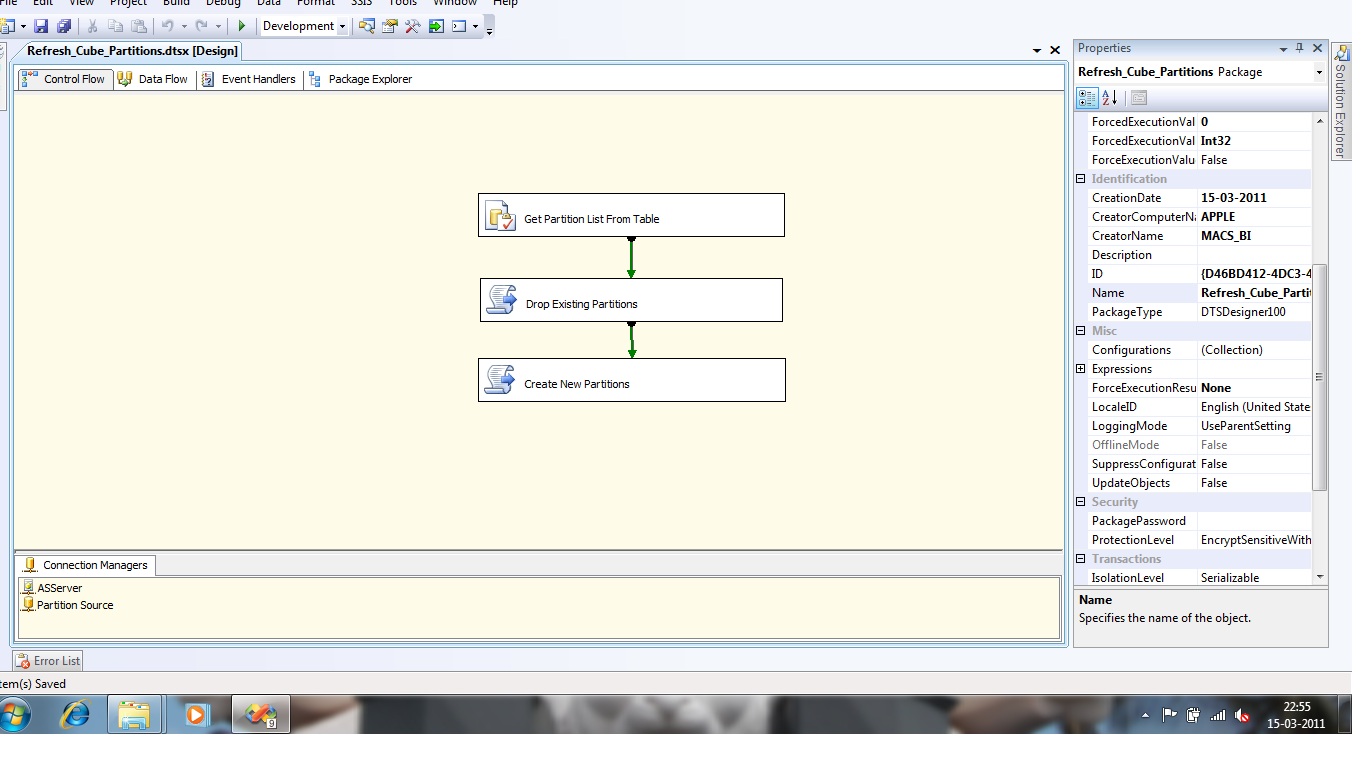
3) About Cube-Partions.its advantage.
We used Partitions to Improve query performance.
A partition is a file on a hard disk that contains a subset of the data included in an Analysis Services database. Partitions let you spread data over multiple hard disks. This includes combinations of both local (stored locally on hard disk) and remote (distributed across multiple hard disks) partitions. Partitions rely on storage settings to define the format and processing schedule for the database, and they use writeback settings to enable what-if analysis. What-if analysis enables a user to input their own data and evaluate the changes that cascade throughout their cube.
Method to create Partitons:
http://www.mssqltips.com/tip.asp?tip=1549

4) What is the use of data source view.
Data Source Views (DSV) have been introduced in SQL Server Analysis Services (SSAS) 2005. A DSV is a metadata layer between the cube and the underlying data source that allows us to build our cubes without being connected to the underlying source
5) iIhave 10 dimensions.i will delete one.and i will process the cube .is that deleted dimension will available in cube?
If you want to remove the dimension from the cube, you can hide/delete the dimension then re-deploy the cube and you need to perform the full process then the deleted dimension won’t appear in the cube.
6) diff b/w calculated members and calculated measures
Member is nothing but column on dimension table. Measure is nothing but column on fact table.
The term calculated member refers to the creation of any MDX object through a calculation. The calculated member can be part of the measures dimension where a simple MDX expression such as addition or subtraction of two or more base measures results in a new measure. Such calculated members on the measure dimension are referred to as calculated measures.
Calculated Member is related to the Dimension where as calculated Measure is related to the measure in measure group.
http://msdn.microsoft.com/en-us/library/ms166568.aspx
SSRS
1) types of parameters
Single value parameters, Multi value parameters,
Cascading parameters (one parameter is dependent on another parameter selection)
http://msdn.microsoft.com/en-us/library/aa337234.aspx
http://sql-bi-dev.blogspot.com/2010/07/report-parameters-in-ssrs-2008.html

2) what are drill through and drill down reports.
Drill down is when a power play model has several levels within a hierarchy. Given a location dimension with country/ state and city. A starting view will show the summary of countries, Drill down on one country will expose their states, drill down on a state will show their cities. So drill down goes to lower levels of a dimension as designed in the model.
Drill thru is the ability to leave PowerPlay and call a SQL Query, (say in Impromptu) passing the dimension line as filters to the query. If the columns in the query match the columns used to build the dimensions the query will automatically apply those values to the where clause. You can write any query or queries you want to support a drill thru from a cube. Context is important to balance the two
Database
1) How u done partitions.
If your database contains very large tables, you may benefit from partitioning those tables onto separate filegroups. This technology, introduced in SQL Server 2005, allows you to spread data onto different physical disks, leveraging the concurrent performance of those disks to optimize query performance.
http://www.mssqltips.com/tip.asp?tip=1914

2) Difference b/w view and materliazed view.
Views
A view takes the output of a query and makes it appear like a virtual table. You can use a view in most places where a table can be used.
All operations performed on a view will affect data in the base table and so are subject to the integrity constraints and triggers of the base table.
A View can be used to simplify SQL statements for the user or to isolate an application from any future change to the base table definition. A View can also be used to improve security by restricting access to a predetermined set of rows or columns.
In addition to operating on base tables, one View can be based on another, a view can also JOIN a view with a table (GROUP BY or UNION).

Materialized Views
Materialized views are schema objects that can be used to summarize, precompute, replicate, and distribute data. E.g. to construct a data warehouse.
A materialized view provides indirect access to table data by storing the results of a query in a separate schema object. Unlike an ordinary view, which does not take up any storage space or contain any data.

The existence of a materialized view is transparent to SQL, but when used for query rewrites will improve the performance of SQL execution. An updatable materialized view lets you insert, update, and delete
3) Have u worked with sequences.
CREATE SEQUENCE will enter a new sequence number generator into the current database. This involves creating and initializing a new single-row table with the name seqname. The generator will be owned by the user issuing the command.
http://blogs.msdn.com/b/sqlcat/archive/2006/04/10/sql-server-sequence-number.aspx

4) About logging in view.
http://www.stanford.edu/dept/itss/docs/oracle/10g/server.101/b10759/statements_6003.htm

Frequently asked Sql Queries with answers
http://blog.sqlauthority.com/2007/04/21/sql-server-interview-questions-and-answers-complete-list-download/
http://www.java2s.com/Code/SQLServer/CatalogSQLServer.htm

Some Other Interview Questions:
http://www.bigresource.com/MS_SQL-ssis-master-package-fail--MaixRNiy.html
Try to get the info from net.I do not have time to explain all these...
DTS vs SSIS: A basic overview
http://decipherinfosys.wordpress.com/2008/03/11/dts-vs-ssis-a-basic-overview/
How to create a basic Cube
http://www.mssqltips.com/tip.asp?tip=1532

Monday, January 17, 2011

SSRS-Types of Reports

In Reporting Services, you can use reports in a variety of ways. This topic describes the terminology used to describe the various types of reports and the ways reports get created and used. A single report can have characteristics from more than one type; for example, snapshot reports can be parameterized, ad hoc reports incorporate clickthrough report functionality due to the report models upon which they are based, and subreports can be linked reports.
With Reporting Services, you can create the following types of reports:
Parameterized reports
Linked reports
Snapshot reports
Cached reports
Ad hoc reports
Clickthrough reports
Drilldown reports
Drillthrough reports
Subreports
http://ssrstips.blogspot.com/2009/07/in-reporting-services-you-can-use.html

SSRS report Design Style-Details(***Tablix***)


• Report Design Basics
• Specifying Report Data
• Organizing Report Data on a Page
• Improving the Report Design

http://ssrstips.blogspot.com/2009/07/report-design-basics.html
http://ssrstips.blogspot.com/2009/07/tablix-data-region-in-ssrs.html

SSRS Complex Expressions

Complex expressions can contain multiple built-in references, operators, and function calls, and appear on the design surface as <>. To see or change the expression text, you must open the Expression dialog box or type directly in the Properties pane. The following table lists typical ways you can use a complex expression to display or organize data or change report appearance, including the property to set, the dialog box you typically use to set it, and the value for the property. You can type an expression directly into a dialog box, on the design surface, or in the Properties pane.

Functionality Property, Context, and Dialog Box Property Value

1. Calculate aggregate values for a dataset. Value property for a placeholder inside of a text box. Use Placeholder Properties Dialog Box, General. =First(Fields!Sales.Value,"DataSet1")
2. Concatenate text and expressions in the same text box. Value for a placeholder inside of a text box that is placed in a page header or page footer. Use Placeholder Properties Dialog Box, General. ="This report began processing at " & Globals!ExecutionTime
3. Calculate an aggregate value for a dataset in a different scope. Value for a placeholder inside of a text box that is placed in a tablix group. Use Placeholder Properties Dialog Box, General. =Max(Fields!Total.Value,"DataSet2)
4. Format data in a text box depending on value. Color for a placeholder inside of a text box in the details row for a tablix. Use Text Box Properties Dialog Box, Font. =IIF(Fields!TotalDue.Value < 10000,"Red","Black")
5. Calculate a value once to refer to throughout the report. Value for a report variable. Use Report Properties Dialog Box, Variables. =Variables!MyCalculation.Value
6. Include specific values for more than one field from a dataset. Filter equation for a group in a tablix. Use Tablix Properties Dialog Box, Filters. For data type, select Boolean.
7. =IIF(InStr(Fields!Subcat.Value,"Shorts")=0 AND (Fields!Size.Value="M" OR Fields!Size.Value="S"),TRUE, FALSE)
8. =
9. TRUE
10. Hide a text box on the design surface, that can be toggled by the user using a Boolean parameter named Show. Hiddenproperty on a text box. Use Text Box Properties Dialog Box, Visibility. =Not Parameters! Show .Value
11. Specify dynamic page header or footer content. Value for a placeholder inside of a text box that is placed in the page header or footer. ="Page " & Globals!PageNumber & " of " & Globals!TotalPages
12. Specify a data source dynamically by using a parameter. Connection string on the Data source. Use Data Source Properties Dialog Box, General. ="Data Source=" & Parameters!ServerName.Value & ";initial catalog=AdventureWorks2008R2"
13. Identify all the values for a multivalue parameter chosen by the user. Value for a placeholder inside of a text box. Use Tablix Properties Dialog Box, Filters. =Join(Parameters!MyMultivalueParameter.Value,", ")
14. Specify page breaks for every 20 rows in a tablix with no other groups. Group expression for a group in a tablix. Use Group Properties Dialog Box, Page Breaks. Select the option Between each instance of a group. =Ceiling(RowNumber(Nothing)/20)
15. Specify conditional visibility based on a parameter. Hidden property for a tablix. Use Tablix Properties Dialog Box, Visibility. =Not Parameters!< boolean parameter >.Value
16. Specify a date formatted for a specific culture. Value for a placeholder inside of a text box in a data region. Use Textbox Properties Dialog Box, General. =Fields!OrderDate.Value.ToString(System.Globalization.CultureInfo.CreateSpecificCulture("de-DE"))
17. Concatenate a string and a number formatted as a percentage to two decimal places. Value for a placeholder inside of a text box in a data region. Use Textbox Properties Dialog Box, General. ="Growth Percent: " & Format(Fields!Growth.Value,"p2")

Monday, January 3, 2011

Sql Server/SSAS/SSRS Discussion Forum AND Questions

Hi Guys,

Here i have listed couple of discussions on Sql Serv 2005/2008.Here you can find SSRS/SSAS questions as well.
Please utilize this opportunity to involve this forum.
Here i just did copy/paste job.

Bunch Of Thanks to--> "StackOverFlow".

http://stackoverflow.com/tags/reportingservices-2005/new

reportingservices-2005
ssrs-2005
reportingservices2005
reporting-services-2005
reporting-services
sql-server-2005
sql-server
ssrs-reports
asp.net
reporting
c#
reportingservices-2008
sql
ssrs-2008
reportviewer
vb.net
.net
bids
excel
iis
parameters
pdf
printing
rdl
subreport
visual-studio
web-services
table
tsql


Regards,
Ravindra